

Lithium Iron Phosphate (LFP) batteries have become a cornerstone of modern energy storage, powering everything from electric vehicles to grid-scale installations. While their safety, longevity, and cost advantages are well known, LFP batteries also exhibit a subtle but important phenomenon: hysteresis in their open-circuit voltage (OCV) curve. This article explores what OCV hysteresis is, why it occurs in LFP cells, how it impacts battery performance and management, and how to overcome it to ensure system reliability.
What Is OCV Hysteresis in LFP Batteries?
Open-circuit voltage (OCV) is the voltage measured across a battery’s terminals when it is at rest, with no external load or charging current applied. In many lithium-based battery types, the OCV at a given state of charge (SOC) would be unique and reproducible, regardless of whether the battery was previously charged or discharged.
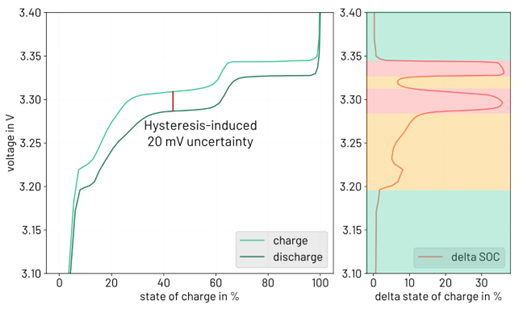
However, in LFP cells, the OCV curve exhibits hysteresis: the OCV at a given SOC depends on the battery’s prior charge history—specifically, whether it reached that SOC by charging or discharging. Even after long rest periods, a measurable voltage gap (typically 5–25 mV) remains between the charge and discharge OCV curves, especially in the flat plateau regions that are characteristic for battery cells with LFP cathodes. This effect is depicted in Figure 1. When performing consecutive partial charge and discharge steps, the resulting OCV values tend to fall between the typical charge and discharge curves, indicating a continuum of intermediate states rather than a strict separation between the two.
Why Does Hysteresis Occur in LFP Batteries?
The hysteresis effect in LFP batteries is rooted in both thermodynamic and mechanical phenomena at the material level.
Thermodynamic Origins
LFP cathodes undergo a two-phase reaction during lithiation (charging) and delithiation (discharging). This means that lithium ions are inserted or removed from the crystal structure in a way that creates distinct lithiated (LiFePO4) and delithiated (FePO4) phases. LiFePO4 and FePO4 coexist. It is just the boundary between these two phases that shifts as the battery charges and discharges. The energy landscape for lithium movement is not identical in both directions. This asymmetry leads to a voltage gap—hysteresis—between the charge and discharge OCV curves.
Kinetic and Diffusion Limitations
The movement of lithium ions within the electrode particles is not perfectly uniform. Diffusion limitations and inhomogeneous lithium distribution can cause localized differences in voltage response, adding another layer to the observed hysteresis. Additionally, both the electronic and ionic conductivities in LFP are relatively poor, which reduces the driving force for equalizing these inhomogeneities.
Impact of OCV Hysteresis on Battery Performance
OCV hysteresis in LFP batteries is more than a scientific curiosity; it has tangible consequences for battery operation and management.
State-of-Charge (SOC) Estimation Challenges
The primary issue with the hysteresis effect is LFP batteries is its complication of SOC estimation. Battery management systems (BMS) often rely on the OCV-SOC relationship to estimate how much charge remains in a cell. Hysteresis complicates this process: the same OCV value can correspond to different SOC values depending on the battery’s recent charge/discharge history. This is especially problematic in the flat plateau region of LFP OCV curves, where small voltage differences represent large changes in SOC (see Figure 1).
In practice, this means that operators relying on BMS-estimated SOC to make trading and operational decisions are often relying on incorrect values, leading to missed revenue opportunities or market compliance penalties.
How to Overcome LFP Hysteresis
The hysteresis effect in LFP batteries is a common, but complex, issue. To gain precision, modern tools like advanced battery analytics are necessary.
Why Traditional SOC Estimation Fails
Battery Management Systems (BMS) typically estimate SOC using a combination of coulomb counting and voltage-based methods. While this hybrid approach is effective in some chemistries, it breaks down with LFP cells due to two main reasons: the flatness of the OCV curve and the presence of hysteresis.
Flat Voltage Plateau: In the plateau regions, even small errors in voltage measurement can translate into major SOC estimation errors—sometimes exceeding ±15%.
Hysteresis Gap: A given voltage reading can correspond to multiple SOC values, depending on the cell's recent charge/discharge history. This ambiguity makes it impossible for a BMS to assign a unique SOC from OCV alone.
Even the most advanced BMS algorithms, such as those incorporating Kalman filters, ultimately rely on these same foundational methods and thus inherit their limitations.
Cloud-based Predictive Battery Analytics
ACCURE’s battery analytics platform is not constrained by hardware limitations. Instead, it runs powerful algorithms in the cloud, leveraging three critical tools:
Fleet Comparisons
Unlike a BMS, which operates in isolation, cloud analytics compare the performance of one battery against a global fleet. This allows for identification of anomalous behavior and compensation strategies based on how similar batteries perform under similar conditions. For example, SOC estimates can be refined using benchmarked trends across thousands of LFP cells.
Hysteresis Sub-Models
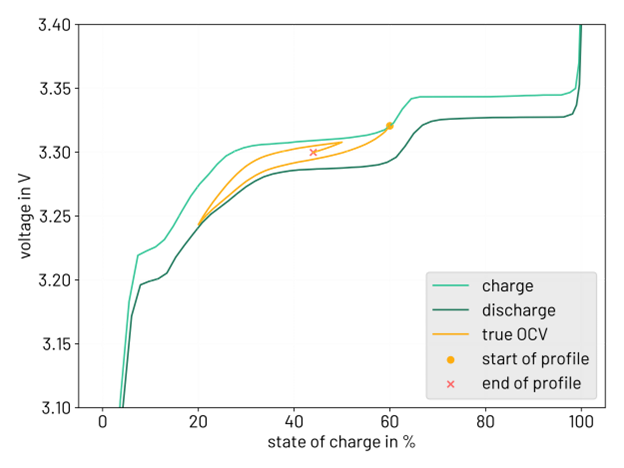
Advanced models include hysteresis sub-models that describe how the battery transitions between charge and discharge OCV curves over time. These models account for the dynamic nature of OCV and can interpolate a better SOC from a voltage reading far more accurately than a BMS can. As illustrated in Figure 2, the orange line represents the actual OCV trajectory during a cycle, offering a more accurate reflection of the true SOC than static charge/discharge OCV curves alone. It begins at 60% SOC, where the battery is then discharged, causing the OCV to gradually converge toward the discharge OCV curve. This is followed by a charging step, prompting the OCV to shift and approach the charge OCV curve instead. A final short discharge leads the OCV to move slightly back toward in the direction of the discharge curve. By the end of the profile, the orange line reveals where the current OCV lies between the two reference curves, highlighting the dynamic nature of OCV under real cycling conditions.
Real-World Impact
In practice, these capabilities translate into actionable benefits. Operators who integrate cloud-based SOC estimates into their trading platforms can:
- Avoid missed revenue opportunities during peak demand periods
- Reduce penalties from market non-compliance
- Increase usable battery capacity by minimizing the need for conservative safety buffers
- Enhance long-term battery health by preventing unnecessary cycling and stress
In one documented case, a European operator reduced SOC errors from up to 45% down to just ±3% after implementing advanced analytics—a transformation that directly boosted profitability and compliance
Conclusion
The hysteresis effect in the OCV curve of LFP batteries is a fundamental characteristic that arises from the interplay of thermodynamics, mechanics, and kinetics at the electrode level. While it poses challenges for SOC estimation, energy efficiency, and long-term durability, understanding hysteresis is essential for accurate battery modeling and effective management. As LFP batteries continue to power the transition to cleaner energy, ongoing research into hysteresis and advanced tools like predictive battery analytics will help unlock even greater performance and reliability.
Frequently Asked Questions (FAQs)
1. What is OCV hysteresis in LFP batteries?
OCV hysteresis refers to the phenomenon where the open-circuit voltage (OCV) at a given state of charge (SOC) differs depending on whether the battery was charged or discharged, with a typical voltage gap of around 5–25 mV even after resting.
2. Why does OCV hysteresis occur in LFP cells?
It arises from thermodynamic and kinetic factors: during charging and discharging, LFP undergoes a two-phase reaction between LiFePO₄ and FePO₄, and lithium distribution and diffusion limitations further contribute to voltage asymmetry.
3. How does hysteresis impact SOC estimation?
Because the same voltage can correspond to different SOCs depending on the battery’s history, traditional battery management systems (BMS) using OCV‑SOC lookups struggle with accurate SOC readings. This is especially critical in LFP’s flat voltage plateau regions.
4. Why can't advanced BMS methods fully correct for hysteresis?
Even sophisticated algorithms like Kalman filters depend on voltage-based SOC estimation and cannot uniquely resolve SOC from OCV alone due to hysteresis and the flatness of the LFP voltage curve.
5. How can hysteresis be mitigated or compensated?
Cloud‑based predictive battery analytics offer a powerful solution:
- Fleet comparisons: Analysing data from fleets of similar batteries helps identify patterns and correct anomalous behavior.
- Hysteresis sub‑models: Dynamic models interpolate the actual OCV trajectory between charge and discharge curves, enabling more accurate SOC estimates.
6. What tangible benefits result from this advanced analytics?
Operators have seen remarkable improvements—some cases report reducing SOC estimation errors from as high as 45% to about ±3%, leading to more reliable trading decisions, reduced penalties, greater usable capacity, and overall increased profitability.
7. What is the practical significance of understanding hysteresis in LFP batteries?
Recognizing and modeling hysteresis is essential for accurate SOC estimation, enhancing energy system reliability and performance. As LFP batteries become more widespread in clean energy systems, advanced analytics are key to unlocking their full potential.
